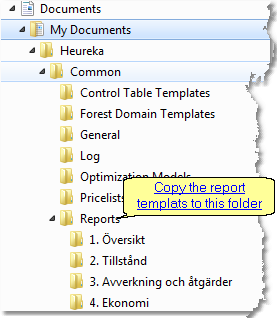
PlanWise, RegWise and PlanEval has a built-in report generator (Report Builder) to calculate the totals and averages for an analysis area that you have made a simulation or optimization for. The report generator is built around report templates that you create once and then reuse. Report templates are saved as files with the extension " .heurd " under C: \ My documents \ Common \ Reports. PlanWise and RegVis loads all the templates available in that folder. You can copy the templates from other users or download from here.
There are a number of different aggregations available:
Funktion
|
Kodnamn
|
Beskrivning
|
|
|
Sum
|
Sum, for example total volume.
|
|
|
AvgOverSubset
|
Average per area unit for a subset or for all stands
|
|
|
AreaSum
|
Area sum, for example area of final felling in a period
|
|
| 1. | Select (PlanWise) or (RegWise) |
| 2. | In the box to the left, right-click and select … and then … to open the dialogue box |
| 3. | Click the button “…” to add a variable. |
| 4. | In the field “”Amount function” you can select the different value functions described above. |
| 5. | The field “Area” should normally be set to “RepresentativeArea”. |
| 6. | In the field “Variable” you select the variable of interest. |
| 7. | You can add conditions for subtotals or mean values for selections. For example, total volume of stands with site index above 20, is created as follows: |
| b. | Select a condition variable (in this case SiteData.SiteIndex >20). |
| c. | Select amount operator “>=”, and type the value 20. |
|
|
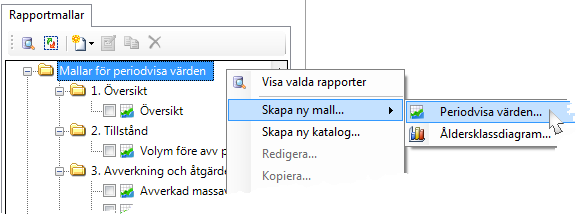
| 1. | Right-click in the window Report templates and select “Create new template”> “Periodic values” (see Create new report template above). |
| 3. | Select “Areasum” as the amount function. |
| 4. | Let “Areatype” = “Representative area”. |
| 5. | Type “Area final cutting” as “Alias”. |
| 6. | Click on “Add condition”. |
| 7. | Click on “Condition” and select “Select variable…” |
| 8. | Select “Treatment” under result type “Treatments” and click on OK. |

| 9. | Select “Belong to” as operator |
| 10. | Select “Select more values”: |
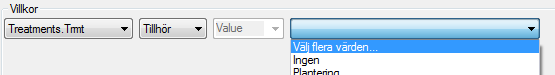
| 11. | Mark “final cutting” and “final cutting with seed trees” and OK. |

| 12. | It will now look like this. |

| 14. | Repeat steps 2-13 but for thinning. |
| 15. | Type e.g. “Treated areas” as “Diagram header”. |
| 16. | Select the desired diagram type and standard view, you can, for example, select bar diagram. This is what it looks like when you are finished: |

| 18. | To use the template, mark it in the window “Report templates”, select at least one simulation and click on “Show selected reports”. |

|
This example illustrates how to create a report with a condition between two variables, in this case age and lowest allowable age for final cutting.
| 1. | Create new report template (see above). |
| 3. | Select “Amount function” = “AreaSum”, and “AreaType” = “Representative area”. |
| 4. | Add a condition that Forest Before MeanAgeExclOverstorey >= TreatmentUnit MinFinalFellingAge * 1.1. For creating a condition between two variables, the operator will be changed from “Value” to “Variable”. It will now look like this: |

|
When you calculate the mean diameter of harvested trees, it is appropriate to calculate volume-weighted mean values.
| 1. | Right-click in the window Report templates and select “Create new template”> “Periodic values” (see Create new report template above). |
| 3. | Select “Aggregate Type” = “Average. |
| 4. | As a variable, select “Dgv Harvest” under the result type “Treatments”. |
| 5. | Define Alias, e.g. “Dgv i uttag”. |
| 6. | Mark “Weighted mean value” |
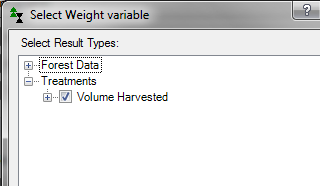
| 7. | Select “Volume Harvested” under “Treatments” as a weighting variable. |
| 8. | Add the conditions for the treatment that will be final harvest, see example above with area thinning and final cutting. |
| 9. | Repeat steps 2-7 for thinning with and without conditions. When you are ready, it will look like this: |

The equation has a weighted mean value that looks like this:
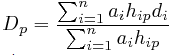
Dp = mean diameter for harvested trees for all stands in period p
n = number of stands (treatment units)
ai = area of stand i
hip = harvested volume in stand I during period p
dip = mean diameter of harvested trees in stand I during period p
|
|
| 1. | Select (PlanWise) or (RegWise) |
| 2. | Right-click in the box to the left and select and follow instructions. The naming of the templates and column headers are currently only available in Swedish. |
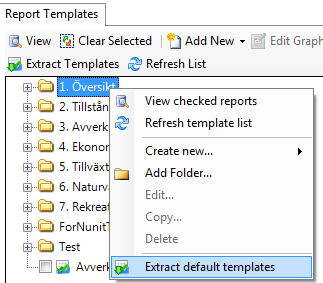
| 3. | If this doesn’t work, templates can be found here which you can download and then copy to folder Documents/Heureka/Common/Reports: |
|
See also:Report Builder på HeurekaWiki
 Swedish


