Diagram Windows (StandWise)
 Swedish

Contents
StandWise has its own report generator. This is how you create a diagram template:
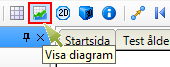
| 1. | Open the diagram view by right-clicking the button Show diagram (which can also be found in the View menu). |
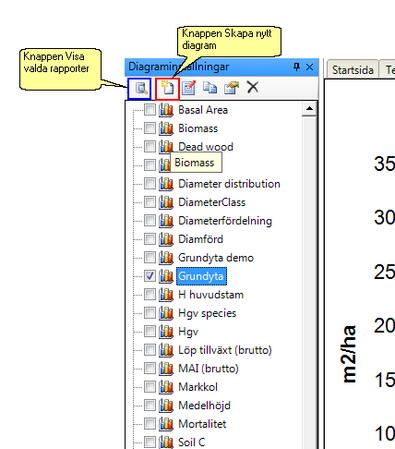
| 2. | To create a new diagram, click on the button Create new diagram (A) |
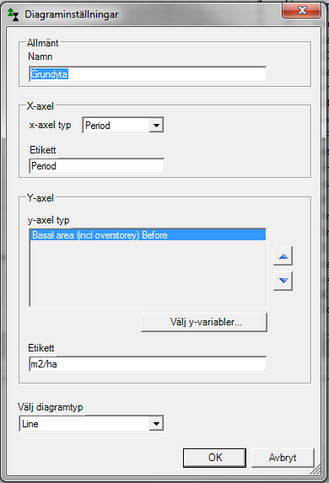
| 3. | Now the dialogue box Diagram settings is shown. In this, you can choose an x-variable (often Period, i.e. time period) and a y-variable. The type of diagram can be selected at the bottom. |
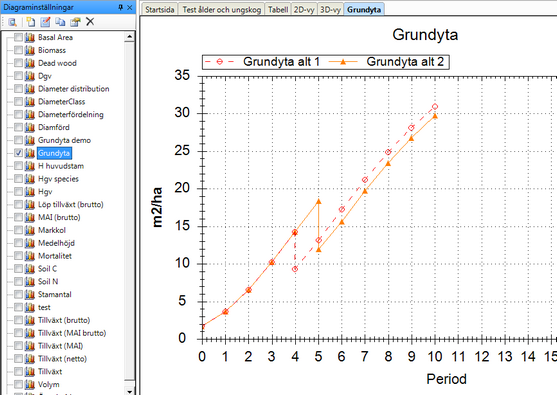
| 4. | To display the diagram, you mark it and click the button Show selected reports. The diagram is shown with all values calculated for each time step in the stand. |