Initial State (PlanWise and RegWise)
 Swedish

Contents
Applications: PlanVis och RegVis
Under the window tab called Initial State, you can find diagrams, tables and maps of the initial state for the stands that are currently selected in the Analysis Area window (3). The page contains three sub-pages: Overview, Details and Map.
Values of parameters ranging from conventional forest variables such as average diameter, average age and growing stock, to model-derived variables such as recreation index and carbon abundance in the soil, are available under the Details tab, as well as thematic maps (where you define classifications) under the Map tab. These windows show stand level information.
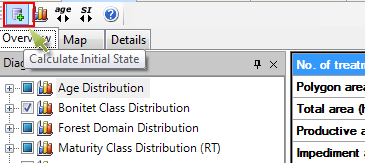
Under the Overview tab (see figure below) you can find summaries, averages and area distributions for a number of common forest variables, such as age distribution, species distribution, and site index distribution (1). A table (2) shows a selection of common forest descriptive data, such as average volume. You can customize, to some extent, the graphs by specifying the desired class width for the age class diagrams. You do this by clicking on one of the two buttons (5) above the graph content list (4).
In the Overview tab (see figure below) you can find summaries, averages and area distributions for a number of common forest variables, such as age distribution, species distribution, and site index distribution (1) . A table (2) shows a selection of common forest descriptive data, such as average volume. You can to some extent customize the graphs by specifying the desired class width for the age class diagrams. You do this by clicking on one of the two buttons (5) above the graph content list (4).

Calculate initial state
If you notice that the graphs or tables do not seem to be updated after making some changes in the project, you could try enforcing recalculation of the initial state, although this is supposed to work automatically.
Export to Excel
You can right click on a chart and select Export to Excel. This will open Excel (in the background) and the chart including numbers will be exported to a new Excel document.