Optimziation Results (PlanWise)
 Swedish

Contents
Applications: PlanWise
Optimisation results can be presented at a stand level in tables and maps, and in the summarising reports created with a report generator where you can flexibly create new report templates. The Results variables & reports chapter provides instructions for producing a report.

Optimisation results at stand level (Details tab)
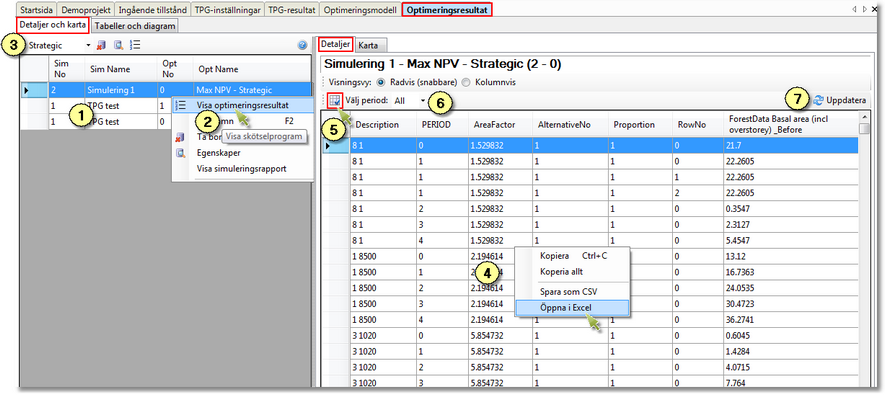
Choose the Optimisation results > Details and map > Details options to show results at stand level in Planwise.
Select the results you want to see from the list to the left (1), right-click and select Show optimisation results (2). If you have used Tactical TPG you choose Tactical in the list for simulation types (3). To select the variables to be shown in the table (4), you click on the button Choose variables (5). The table shows at least one row for each stand, time period and action. If a stand has been subdivided for assignment to several management programs, the column Proportion shows the proportion of the stand area that has been assigned the current management program (AlternativeNo column).
The order of the action is shown in the column RowNo. RowNo=0 denotes the first action in the period or no action. The variable Treatment.Treatment denotes the type of treatment, and the variable Treatment.Year the year it was executed. If you execute more than one treatment in a period, there are rows with RowNo > 0. RowNo = 1 denotes treatment number 2 during the period.
You can choose to show all periods or select a specific period (6).
You can export table (4) to Excel or as a csv-file, or copy as usual to the clipboard. The format fits well for Pivot tables in Excel, if you do something unsuccessfully in the report generator. If you produce Pivot-tables, be aware of the risk of double counting periods with several actions, i.e. use RowNo = 0 as files if necessary.
All values in the table denote values per ha (productive forest). They will be multiplied by the variable AreaFactor, always shown in the table (third column) and Proportion.Proportion, which denotes the proportion of the stand that will be treated with a particular management program alternative.