Dead Wood Control table
 Swedish

Contents
See also: https://www.heurekaslu.se/wiki/Category:Dead_Wood and https://www.heurekaslu.se/wiki/ControlTable_Dead_wood
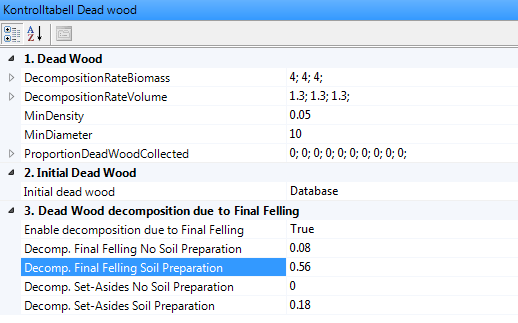
In the Dead Wood control table you can set decomposition coefficients for dead wood, whether the amount of dead wood will be registered or calculated, and effects of final felling on the abundance of dead wood. The simulated abundance of dead wood is presented in the Dead Wood results section.
Besides being a result in itself, dead wood values are used in the calculations of recreation index (https://www.heurekaslu.se/wiki/Recreation_value) and carbon store (https://www.heurekaslu.se/wiki/Carbon_sequestration/sv).
Heureka uses the National Forest Inventory’s five decomposition classes for dead wood (https://www.heurekaslu.se/mw/images/3/36/RIS_Falt.pdf, section 7:28):
0 = Fresh wood, newly wind-thrown trees with green needles or leaves. Wind-thrown trees without green needles or leaves are also classified as fresh wood if the cambium is fresh. 1 = Hard dead wood. The stem volume consists of more than 90% of hard wood with a hard surface area. The stem has been affected by decomposers very little. 2 = Slightly decayed wood. The stem consists of 10-25% soft wood, the rest of hard wood. Tools such as a soil stick can penetrate the surface, but not through all of the sapwood. 3 = Decayed dead wood. The stem volume consists of 26-75% soft or very soft wood. 4 = Very decayed wood. The stem volume consists of 76–100% soft or very soft wood. Tools such as a ground probe can penetrate the whole stem, but hard heart wood may be present.
The prognoses in Heureka determine the classes based on calculated density, which are based on calculated biomass and volume values. The density values for each of the classes are described in Sandström et al. (2007).
|
Dead wood is added continuously as a result of the calculated mortality. The abundance of dead wood in a time period is based on the mortality, and decomposition of already dead wood, in the preceding period. Dead wood is divided into decomposition classes, depending on calculated density (Sandström et al. 2007). There are five decomposition classes (each subdivided into two subclasses), which the model uses to increase the resolution and detail of decomposition calculations. The density is calculated as the ratio between the dead wood biomass (dry matter) and its volume. This is done for each decomposition class, and for each period a new ratio is calculated for every class, which may result in some of the volume in a given class being transferred to a different decomposition class.
The decomposition functions, from Harmon et al. (2000), have the form:
Vt = (Vt0 × (1–a) × exp(–k(t – t0))
where Vt = volume in year t, t0 = the year when the tree died, Vt0 = the volume when the tree died, a = proportion of dead trees (trees that died during the period) that are harvested, k = annual decomposition rate (% that decomposes and disappears every year)
The biomass function is analogous, but V is replaced by B for biomass, and another value is used for the decomposition rate (k), which is found in the control table under DecompositionRateBiomass and DecompositionRateVolume. Different k-values can be given for pine, spruce and deciduous trees. The default values are taken from Harmon et al. (2000).
MinDensity denotes the density of dead wood that can no longer be detected or measured. If the density in a decomposition class falls below this value, it is removed from the presentation.
MinDiameter denotes the smallest diameter for small dead trees included in the calculation of abundance of dead wood.
ProportionDeadWoodCollected denotes the proportion of mortality occurring in a period that is harvested, and will not be retained in the stand as dead wood.
|
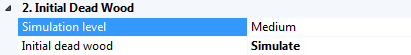
If the amount of dead wood has been inventoried, it can be read from the database, using the control table parameter Initial dead wood = Database. If no such data are available, you can use statistics from the National Forest Inventory. The parameter is then set to Initial dead wood = Simulate. Three different levels can be selected: Low, Medium or High. Depending on the choice, each stand is assigned a certain amount of dead wood in the initial period (Low = 2.15, Medium = 4.3 and High = 8.6 m3sk/ha). This dead wood is distributed among decomposition classes by a function that is also based on National Forest Inventory data.
If you use stand register data as input, there are columns for registering initial amounts of dead wood. There are also columns for registering the amount of dead wood present in each decomposition class.
You can also choose Initial Dead Wood = None, which means there is no dead wood at the start.
|
There are high risks that much of the dead wood will be destroyed by site preparation or harvesting machines (Hautala et al. 2004).
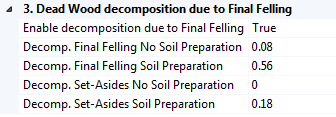
If you let Enable decomposition due to Final Felling be True (default), some of the dead wood in classes 0, 1, 2 and 3 will be severely damaged and become class 4. For class 0-3, a similar share of what was found in each class before final felling is transferred.
Decomp. Final Felling No Soil Preparation denotes the proportion of the dead wood in classes 0-3 that is destroyed (and transferred to class 4) when the stand is clearcut, but no site preparation is done. Thus, this represents effects on the dead wood of the harvester machines, and by default it is low compared to site preparation.
Decomp. Final Felling Soil Preparation denotes the proportion of the dead wood in classes 0-3 that is destroyed (and transferred to class 4) by harvester machines and site preparation.
Decomp. Set-Asides No Soil Preparation denotes the proportion of the dead wood in decay classes O-3 that is destroyed (and transferred to class 4) in a retention patch (=Set aside Nature Conservation area) of a stand that is clear cut and no site preparation is done. Thus, this represents effects on the dead wood due to the clearcut operation per se, and is by default low compared to the site preparation operation.
|
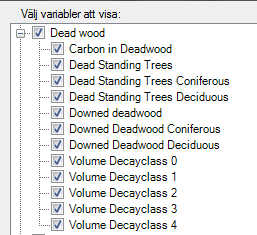
For each presented class, the proportions of dead wood comprised of standing and lying dead trees and logs are calculated, based on statistics from the National Forest Inventory.
In the results no separate values for standing and lying dead wood are presented. Instead, sums in all decomposition classes are provided (see Results variables below).
|
The calculated abundance of dead wood is presented in the Dead Wood results section.
|
Sandström, F., Petersson, H., Kruys, N., & Ståhl, G.. (2007) Biomass conversion factors (density and carbon concentration) by decay classes for dead wood of Pinus sylvestris, Picea abies and Betula spp. in boreal forests of Sweden. Forest Ecology and Management. Volume: 243, Number: 1, pp 19-27.
Harmon, M. E., Krankina, O. N. , & Sexton, J. 2000. Decomposition vectors: a new approach to estimating woody detritus decomposition dynamics. Canadian Journal of Forest Research 30: 76–84.
Hautala, H., Jalonen, J., Laaka-Lindberg, S., & Vanha-Majamaa, I. 2004. Impacts of retention felling on coarse woody debris (CWD) in mature boreal spruce forests in Finland. Biodiversity and Conservation 13(8): 1541-1554.
|
See also: https://www.heurekaslu.se/wiki/ControlTable_Dead_wood