Show Heurekavariables in maps
 Swedish

Contents
You can use the integrated map viewer both for the initial state and for the plans or scenarios. The difference between the initial state and the plans or scenarios is that the latter can show a map for each time period, and you can scroll back and forth between time periods.
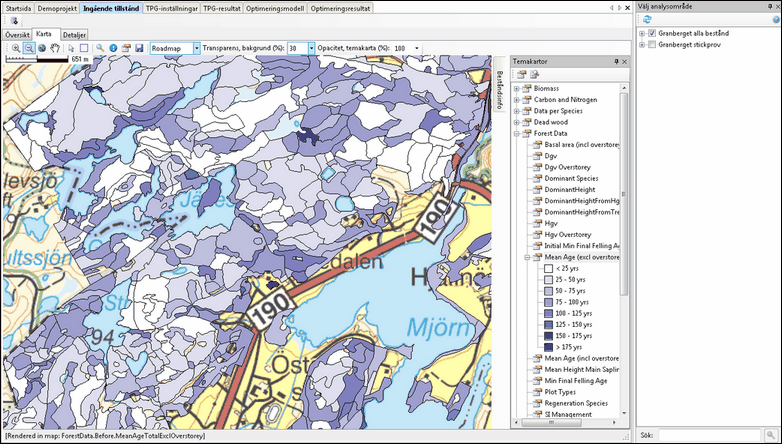
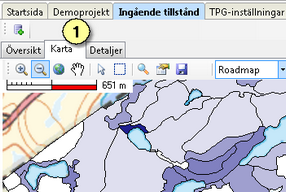
The map viewer in the Initial State window tab.
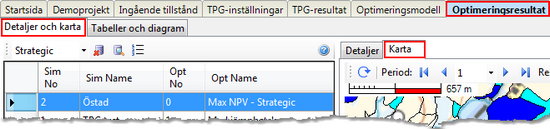
In PlanWise you find the result maps in OptimizationResults > Detals and maps > Map:
In RegWise you find the result maps in the tab Results - Maps:
![]()
A category variable is a typed variable that can have a certain value code. For example, treatments (result variable Treatment in the result group with the same name) is a category variable that can take the value Planting, Cleaning, Thinning etc. (see TreatmentCodes on HeurekaWiki). Other examples are soil moisture and vegetation type (variables Soil Moisture and Vegetation Type, found in the SiteData result group).
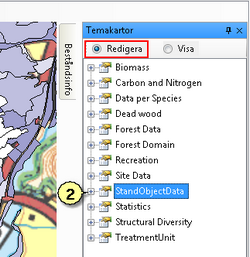
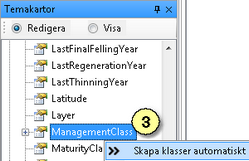
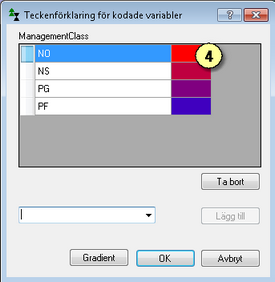
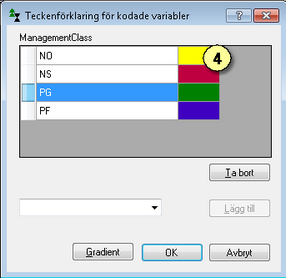
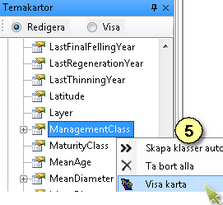
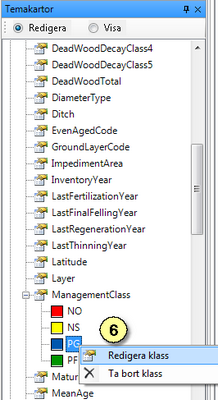
Here is an example illustrating how to create a thematic map for a category variable. If the stand register you imported contains management classes you can make a map showing them. The variable is called ManagementClass and is found in the result group StandObjectData. The possible value codes are PG, PF, NS, and NO. If you have not imported management classes, you can follow the same instructions but for some other variable, for example Vegetation Type
Instructions.
|
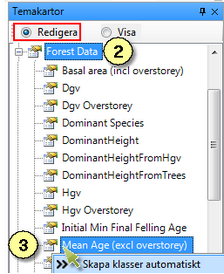
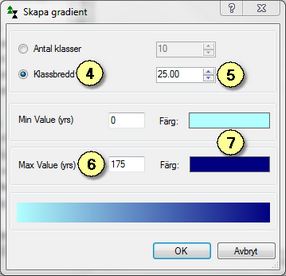
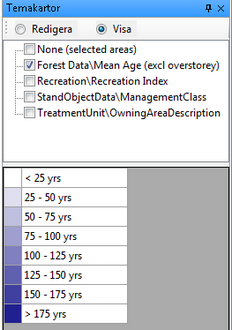
For continuous variables you create classes, by specifying a desired class width and a maximum value.
Here is an example illustrating how to create a map of mean age, with class width 25 years and the last class containing stands 175 years and older. The instructions are very similar to those in the previous section, what differs is step 4.
|
After you have created a legend for a thematic map it is added to the list in the view mode ("View" ), where you can quickly find and select it:
|
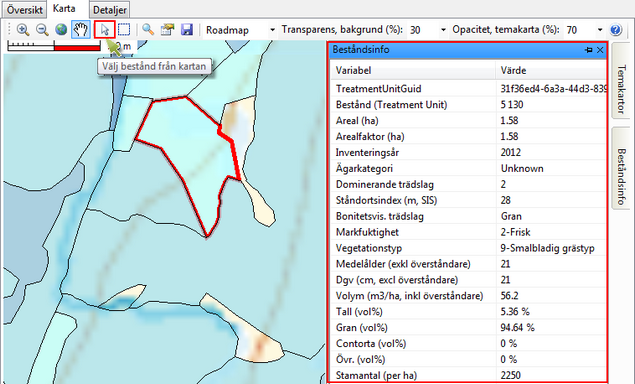
If you click on a stand in the map with the Select Stand tool, some basic stand data is displayed in the Treatment Unit Information window:
|
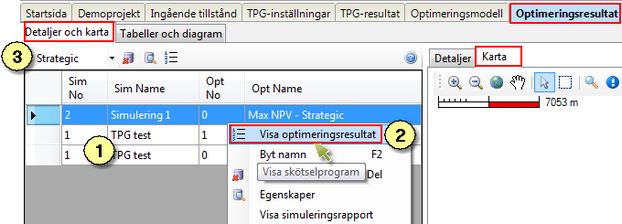
To display maps for a plan created in PlanWise you open the tab Optimization Results > Details and Maps > Map.
Then select the results you wish to view from the list on the left (1), by right-clicking on it and choose Show Result (2). If you have used the Tactical TPG you must select Tactical in the list of simulation types (3).
In RegWise you proceed similarly, but in the Simulation Results - Maps window.
|