Settings dialog
 Swedish

Contents
The Settings dialog contains general application settings, and you can access it via the Tools menu:
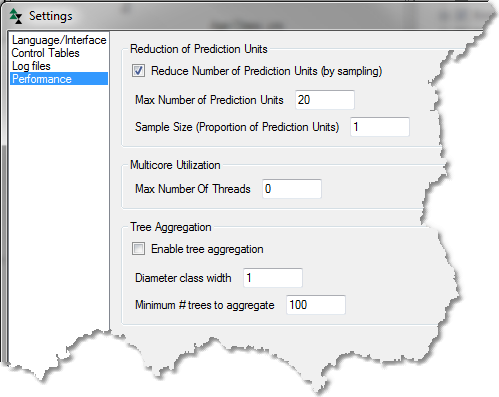
Performance
Under Performance you can find settings that affect the execution times. In addition to utilization of multiple CPU cores, the settings affect the results by grouping trees to a fewer number of type trees, or simply doing calculations on a selection of plots for each stand. By default, there is no aggregation of tree data. However, by default the number of sample plots is limited to 20 per stand. If there are more plots than the limit set, the maximum number of plots is selected randomly.
Control Tables
Under Control Tables you can choose which control tables that are added automatically when you add a new control category. The control tables Treatment Model and Treatment Program Generator are default.
Log files
Here you can enable printing of detailed information from the litter model (Swedish: förnamodellen) used as part of the Q-model (the model for projecting carbon and nitrogen decomposition).
Language/Interface
Here you can select the language and if the control tables should be displayed in detailed or simplified view.