Price lists
 Swedish

Contents
Heureka uses theoretical bucking for calculating the value of harvested trees, in the sense that a tree is optimally bucked relative to a price list. The calculations are made for a large number of types of trees in a preparative step, representing different combinations of diameter, tree height and tree species. If timber prices increase relative to pulp wood prices, the proportion of saw timber will increase, and vice versa. If you consider the timber proportion to be lower than expected, the explanation is that the timber prices are low relative to pulp wood prices. An assumption about future real price changes can be made by setting Apply Price Trend = True, read more in the Price trends section below.
The Price List Manager is opened in the Data management menu or with the tool bar above the control tables (Figure 1). This is found in PlanWise under the tab TPG-settings, in RegWise under Simulation settings, and in StandWise in the top of the Control table window.

Figure 1.
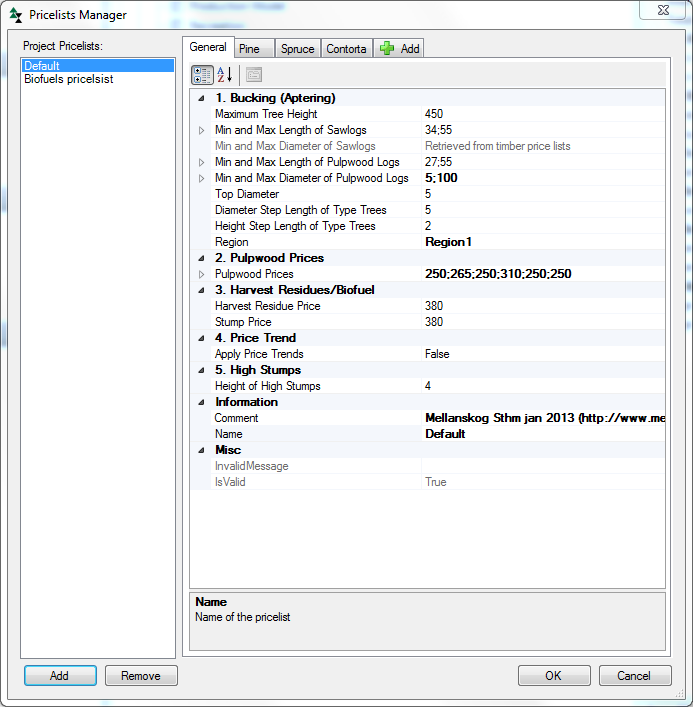
The Price List Manager (Figure 2) includes a list of available price lists (to the left). These will be linked to harvest actions in the Cost and Revenue control table. The linkage is done in the control table because it enables different linkages to be set for different control categories (and forest domains).
Each pricelist has a tab named General (see Figure 2). This is used to set bucking boundaries, prices for biofuel and pulpwood, and possibly price trends:
Figure 2. Price List Manager. |
Timber price lists are set for each desired species/species group in separate tabs, see explanations in Figure 3.
Figure 3. Timber price list example for pine. Click on the image to enlarge it.
|

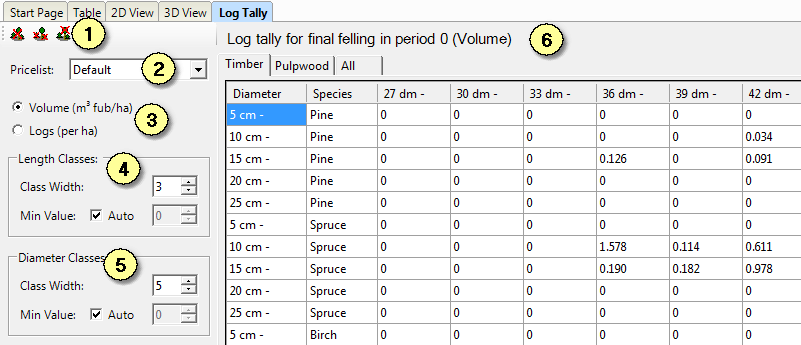
The function Log Tally (in the Show menu) can be used to study the outcome of a treatment in terms of number of logs per diameter, length and assortment class (timber and pulp wood). You can also choose to present the volume (m3fub) per class. All values are given per hectare.
|
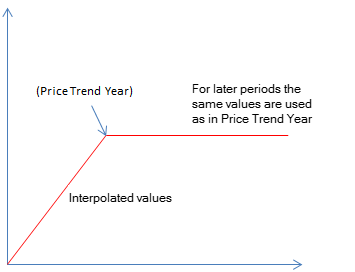
Assumptions on future wood price changes can be added by using price adjustment factors valid from a defined point of time (Price Trend Year). The same can be done for costs, see the Cost and Revenue control table. Interpolation is applied for periods before Price Trend Year. The same adjustment is applied in periods after Price Trend Year as in the given time point (Figure 4).
Figure 4. Illustration of the principle of management of price and cost changes.
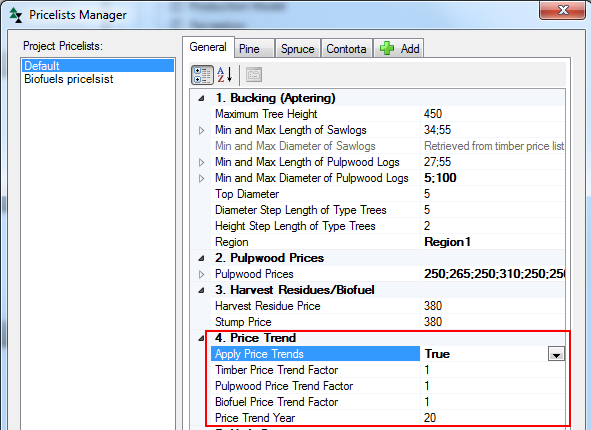
Changes in wood prices affect the bucking and thus the yield, so adjustment factors for this are found here in Price List Manager. They are displayed if Apply Price Trends = True. Separate factors are set for timber, pulpwood and biofuel. The system uses a complementary bucking calculation that takes into account the adjusted prices, where each post in the timber price list is adjusted with the given timber price factor (Timber Price Trend Factor), the pulp wood prices with the given factor for pulp wood (Pulpwood Price Trend Factor), and the prices for biofuel and stumps with the factor for biofuel (Biofuel Price Trend Factor). For example, a value of 1.2 and a Price Trend Year of 20, means that the prices will be 20 % higher than at the start in 20 years.
Figure 5. Settings for a change of future wood prices are made in Price List Manager. |