Report Builder
Revision as of 12:44, 18 June 2010 by Peder (talk | contribs) (→Mean diameter of harvested trees in thinnings)
Creating tables and graphs with the report builder
With the Report Builder in PlanWise and RegWise you can create templates that will be stored in C:\My documents\Heureka\Common\Reports. At startup, the program will check for files with the file extension "heurd" in that folder. Each such file holds information of a graph and a table. You can share templates with other users by copying files to that folder. Follow these steps to create a new template (see also examples):
- Select the tab "Optimization Results > Tables and Graphs" (PlanWise) or "Simulation Results > Tables and Graphs" (RegWise).
- In the list "Tables and Graphs" to the left, right-click and select "Create New", and "Period Graph"
- In the Report Builder, click "Add" to add a variable. You can choose different kind of aggregate functions:
- Sum = sum of a variable, for example volume
- Mean = average value of a variable
- Sum of Area = areal sum, for example area of final felling
- Area should normally be set as is, that is "Representative area".
- Select the variable you are interested in.
- You can add conditions to obtain sub sums, or sub averages. For example, to get teh total volume for stands with site index larger than 20, do the following:
- Click on "Add Condition".
- Select a conditioning variable, in this case example SiteData > Site Index.
- Set operator ">=", and type the value 20.
- Click OK.
- Click OK.
- Back in the "Report Builder" window, you can select more variables, for example if you want to create stacked bars, consisting of Volume Harvested and Volume After Harvest in the same graph, or different tree species in the same graph. For example, to make a graph that shows species-wise volumes do the following:
- Click "Add".
- Click "Select Variable" in "Variable"
- Select variable "Data per Species" > "Before" > "Volume" > "Pine", and then "OK".
- Repeat step 3 for all the other species. This may seem tedious, but remember that you only have to create the template once.
- Edit the Y-axis label (you should remove "/ha")
- Name the template and the header.
- Set the default type, for example "StackedBar" if you ran steps 3-4 above.
- Click OK
- The new template will be added to the template list. To view a report, mark a result in the small window above the template list (for example "Max NPV - Strategic", then one or more template, and finally click "View Checked diagrams/reports". If the resulting table or graph is empty, you have problem not included the result variable when you ran the Treatment Program Generator.
- You can find more examples of reports here.
Examples
Here is a number of examples on how to create report templates in report builder. See for instructions on how to use the report builder.
Total final felling area per period
- Select "Create New" > "Period Graph".
- Click the "Add"-button.
- In "Aggregate:", select "AreaSum".
- Let "Area" = "RepresentativeArea".
- Klick "Add Condition".
- Click in "Conditions" and choose "Select Variable..."
- Select "Treatments" > "Treatment" and OK.
- Select "In" as operator.
- Select "Multiple Values".
- Check "Final Felling", and "Final Felling with Seed Trees" and OK.
- In "Report Header:", type "Area Final Felling".
- Click OK.
Total final felling area and thinning per period
- Follow steps 1-10 for "Total final felling..." above.
- Klick "Add Condition".
- Click in "Conditions" and choose "Select Variable..."
- Select "Treatments" > "Treatment" and OK.
- Select "=" as operator.
- From the list, select "Thinning".
- In "Report Header:", type "Area final felling and thinning".
- Select "Stacked bar" as "Default Chart Type".
- You can change the order in which variables are displayed in the graph by using the arrow-buttons. The settings should look like something like this:
- Click OK.
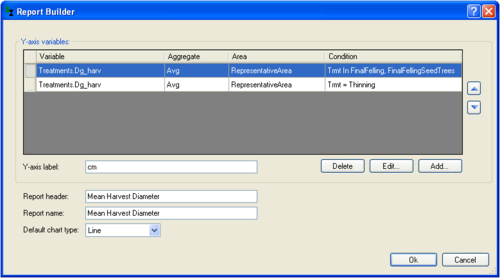
Mean diameter of harvested trees in thinnings
- Select "Create New" > "Period Graph".
- Click the "Add"-button.
- In "Aggregate:", select "Avg".
- Let "Area" = "RepresentativeArea".
- In "Variable: ", select for example "Treatments" > "Dg Harvest" (diameter of mean basal area tree of harvested trees).
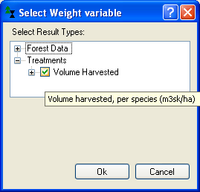
- Check "Use weight variable".
- As weighting variable, select "Treatments" > "Volume Harvested".
- Select Add Condition, and define "Treatment" = "Thinning".
- Repeat steps 2-8, but with the condition that the treatment should be "Final Felling", or "Final Felling With Seed Trees".
- In "Report Header", type "Mean Harvest Diameter". It should look like this: