Difference between revisions of "Result Variables"
| Line 56: | Line 56: | ||
==Mortality== | ==Mortality== | ||
| + | Mortality per tree species (m<sup>3</sup>sk/ha). | ||
==Diameter distribution of cuttings== | ==Diameter distribution of cuttings== | ||
Revision as of 16:08, 17 May 2010
(UNDER CONSTRUCTION)
Introduction
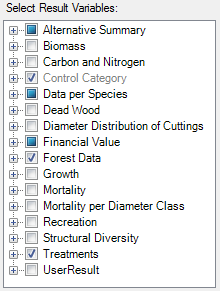
Variables that can be projected by the Heureka system are listed here. Notes:
- Most variables has a before and after-component, which refers to state or value before treatment, and immediately after treatment.
- When you select variables, for example when running the Treatment Program Generator in PlanWise, or when defined the table view in StandWise, you can hover with the cursor over a variable, in the tree view control, to get a short tooltip description.
Alternative summary
- Included
- Dummy indicator
- IsSetAside
- Indicates if the treatment unit is set aside for nature conservation, as part of a parent treatment unit.
- Net present value
- Net present value for the alternative.
- Discount rate
- Discount used when net present value was computed.
Forest data
The Forest Data result category contains result that describe common forest state variables.
- Volume
- Volume per ha
- Stems
- Stems per ha
- Basal Area
- Sum of cross-sectional basal area of trees at breast-height (m2/ha)
- Dg
- Diameter of mean basal area tree (cm)
- Dgv
- Basal area weighted mean diameter (cm)
- Mean age
- Basal area weighted mean age (yrs)
- Hgv
- Basal area weighted mean height (cm)
Species data
Same as forest data, but for each species group. The species group codes in Heureka are currently fixed, see defintion of codes here.
Note: It is a bit inconsistent that these data are not included in Forest data. Other result types, such as "Treatments", store both species-wise data and totals in the same node. Each results type actually represent a table in the result database.
Treatment data
- Dg Harvest
- Dg (diameter of mean basal area tree) of harvested trees.
- Dgv Harvest
- Dgv of harvested trees.
- Regeneration Species
- Main species planted or sowed.
- Regeneration Method
- Planting, Sowing, Seed Trees, or Extensive,
- Stems Harvested
- Stems harvested (per ha), per species.
- Thinning Form
- Thinning form (Dg Harvest/Dg After)
- Thinning Grade
- Percent of basal area harvested.
- Treated Area
- Proportion of stand productive area at which treatmemt was applied.
- Treatment
- treatment applied
- Mean Tree Volume Harvested
- Mean volume (m3sk/tree) of harvested trees.
- Volume Harvested..
- Volume harvested (m3/ha and species).
- Year
- Treatment year, starting from year 0.
- Year Offset
- 2.5 if period midths are used, 0 otherwise.
Harvesting data
Not in use, but will replace part of financial data and treatment data.
Growth
Current and mean annual increment (m3sk/ha,yr). Gross and net values per tree species. Growth refers to growth from previous time (period) to current.
Mortality
Mortality per tree species (m3sk/ha).
Diameter distribution of cuttings
Financial value
Currently consists of revenues, costs, and yields. Some of these will be moved to Treatments.
Biomass
Biomass (ton dry matter/ha) for different parts of the trees, e.g. stem, branches and roots. Summarized per tree species.
Carbon and nitrogen
Carbon and nitrogen (ton/ha) for soil organic carbon and nitrogen.
Dead wood
Dead wood (m3) for different types of dead wood in different decay classes. Summarized per tree species.
Forest domain
- Forest domain
- TreatmentControlCategory
Recreation index
- Recreation index
- Stand-level recreation index as a function of stand structure, see Recreation value.
Statistics
Mean, standard deviation and standard errors for age, volume, and stem density, over sample plots within a stand. Applicable to first period, when data has been collected from field sample plot inventory.
Structural diversity
- Even-aged class
- Tree-size diversity class (Hugin definition).
- Tree-size diversity class (Gini coefficient).
