Thinning
 Swedish

Contents
This chapter describes settings for thinnings.
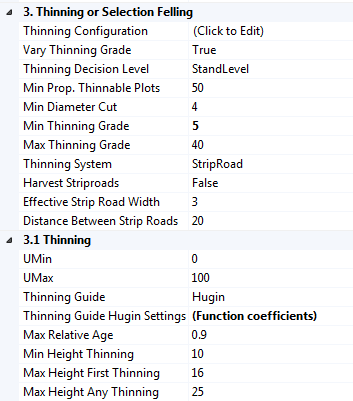
The execution of a thinning is controlled by settings in section "3. Thinning or Selection Felling" in control table Treatment Model (Figure 1). The timing of thinnings is determined both by the thinning guide used (see below), and by setting in control table Treatment Program Generator in PlanWise, and control table Scenario Settings in RegWise.
Section 3 is common for thinnings and selection fellings. Section 3.1 is specific for thinnings and section 3.2 for selection fellings. Thinnings are used when Management System is set to Even-aged, and Selection Fellings when Management System = Uneven-aged.
Figure 1. Control table Treatment Model, section Thinning.
|
||||||||||||||||||||||||||||||||||||||
Thinning guides are used to calculate the thinning grade when a thinning is done, and also a base line for when thinnings are applied. The timing of thinnings do not rigorously follow the selected thinning guide, but are allowed to deviate depending on user-settings in control tables Treatment Model, Treatment Program Generation (PlanWise) and Scenario Settings (RegWise), as explained in this chapter.
When you selected a certain thinning guide, that guide contains several species-wise. In a stand with several tree species, different guides are weighted with respect to species distribution. When a species constitute at least 70 % of the basal area, the thinning guide for that species is used.
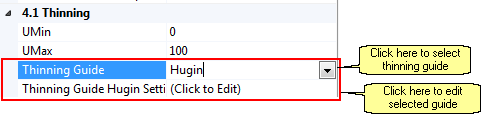
You select what guide to use in parameter Thinning Guide. Depending on what guide you selected, different options are displayed in the row below Thinning Guide with details for the selected guide You can changed the function parameters in a guide if you want
Thinning Guide = Selected guide, one of the following:
Hugin is similar to Skogsstyrelsens thinning guide, but the same guide is used for whole Sweden. It calculates the basal are before and after a thinning as a function of site index (SIS) and dominant height.
Polynomial is used to enter a thinning guide a a polynomial function with at most 6 degrees. It calculates the basal are before and after a thinning as a function of site index (SIS) and dominant height.
Logarithmic is similar to Hugin and Polynomial but uses a function form G = a + b*SIS + c*Ln(DomH), where G is basal area before or after thinning, DomH is dominant height, and a, b and c are coefficient that you can edit.
StemDensity is based on number of stems per ha.
|
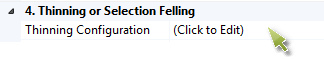
In Heureka you can control both species selection and thinning form in thinnings. If you click "Click to Edit" in control table Treatment Model, the dialog in figure 2 is displayed.
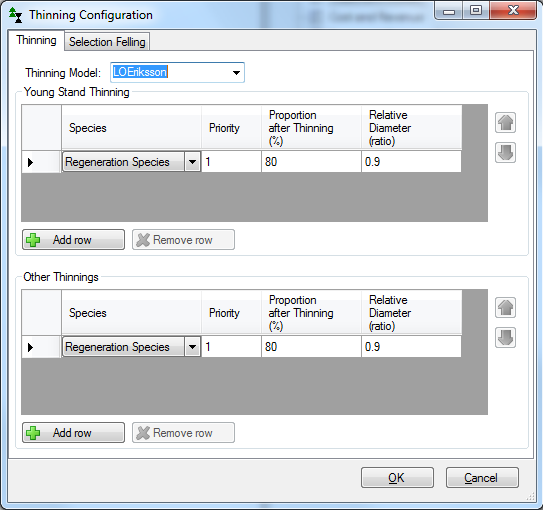
Figure 2. Settings for selection of thinning algorithm, desired species distribution after thinning and selection felling, and thinning form. The thinning form, i.e. thinning from bwlow, uniform thinning, or thinning from above, in the top row is used as default for those species not added to the tables. "Regeneration Species" refers to the planted or sown species if this information is available, and dominant species for otherwise (see Main Species). You can also include several species to the same thinning group.
Thinning Model determines what thinning algorithm that should be used. The thinning algorithm controls how trees are selected in a tree list.
With LOEriksson the ratio between the quadratic mean diameter (dg) of thinned trees and the mean diameter (dg) before thinning is used as control parameter, for each thinning group. It is Sedish practice to express relative diameter in a thinning as the ratio between mean diameter (dg) of thinned trees and the mean diameter (dg) after thinning, and this is calculated in result variable Treatment Data.Thinning Form, so there is a difference in what you enter as control parameter and the reported result.
The second thinning algorithm is called Hugin. This requires three parameters to control a thinning ("From Above/Below", "Second Smallest/Smallest", "Largest/Second Largest", see Heureka Wiki: Gallring for details).
The third option is called HuginOld is the same as Hugin, except for how species distribution is defined. With this option you do not explicitly specify the desired species distribution after thinning, but enter two additional parameters for how the thinned trees should be distributed between the main species groups pine, spruce and deciduous trees. These parameters are called "Deciduous/Conifers" and "Spruce/Pine" (see Heureka Wiki: Gallring for details).
|
In StandWise you can draw strip roads (hauling roads) and mark tree group to be thinned. Strip-roads are created with the Draw-tool
Figure 3. Layout of strip-roads in StandWise, in the 2D-view.
The thinning is performed by clicking on the Thin-button, or from the meny Action...
...and then a similar dialog (Figure 4) is displayed as when you open Thinning Configuration in PlanWise and RegWise. In StandWise the control tables Treatment Program Generator and Treatment Model are available. Settings in these control tables are used when running a simulation in StandWise with the tool "Go to last period". When you simulate a treatment manually via the Action menu or from the Action toolbar, the settings in the dialogs are used. Settings made in the dialogs are saved as part of the application configuration.
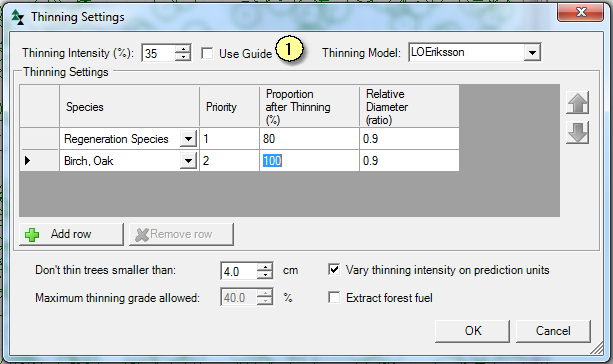
The thinning dialog in StandWise has some additional settings to the control tables and you can enter a desired thinning grade instead of using the thinning guide (see (1) in Figure 4).
Figure 4. Dialog displayed when clicking on the tool Thin in StandWise. and thinning model LOEriksson is selected. In this case we want that 80 % of the basal area should be the regeneration species, and the rest beech and oak, if possible.
|


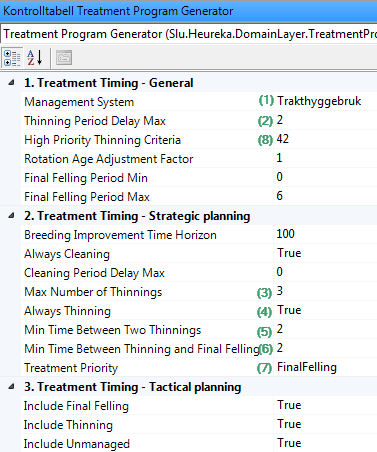
The timing of thinnings is determined not only by the thinning guide (see Simulation of a thinning above) but also by settings in control table Treatment Program Generator. In the latter you enter how many thinning that are allowed during a rotation, and how many time periods a thinning may be postponed as compared to what the thinning guide first suggests. If a thinning is actually simulated depends on whether the criteria for doing a thinning are fulfilled (see Simulation of a thinning).
Figure 5. parameter for thinnings in Treatment Program Generator.
The settings in Figure 5 are displayed when Management System is set to Even-aged (1).
In PlanWise alternative treatment schedules are created by enumeration of every possible combination of cleaning, thinning and final felling period. However, the number of alternatives to save is by default limited to 30. if the number of possible alternatives is larger than the number to be saved, the saved alternatives are selected from a ranking based not only on their net present values, but also on "how different" they are. By default, it is considered more relevant to save two management programs with different final felling periods, than two program with the same final felling period and different cleaning periods. |
After running the treatment program generator you can add constraints to the optimization model for example to limit how large area or how much volume is thinned in each time period.
Here is an example: Example of optimization model constraints
|
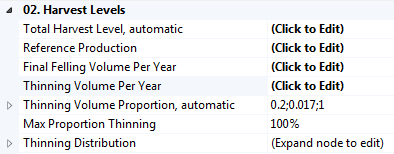
In RegWise the total harvest level in each time period (thinning and final felling) is either calculated automatically or set manually, see How to control the final felling volume in RegWise. Each control category in each forest domain is handled separately. Automatic calculation of thinning volume targetsUnless you explicitly enter values in Thinning Volume Per Year the program will calculate thinning volumes based on the total harvest level (described in Final felling) and with the function Thinning Volume Proportion, automatic. With Max Proportion Thinning you can enter an upper limit for the thinning volume, Note that the autmatoci calculation of harvest level in RegWise only applied to even-aged management, uneven-aged is handled a bit differently (see Selection felling).
Figure 6. Settings for total thinning volumes in RegWise (control table Scenario Settings). Unless you enter a value for a period in Thinning Volume Per Year, the thinning volume is calculated automatically. How to manually set thinning level targets and proportion of thinnings vs. final fellingsAs an alternative to letting the program calculate the target volumes, you can enter them directly in a table (Figure 6). To do this, click on "Click to Edit" next to Thinning Volume and enter the desired thinning volumes (unit 1000 m3sk per year). If a row has a negative value or is missing its mean that the target level will be calculated automatically for that period. Selection of stands to thinIn RegWise, a priority function is used to rank what stands to thin. The function parameters can be modified in Priority Function Thinning. If you click on the function an explanation is displayed at the bottom of the window.
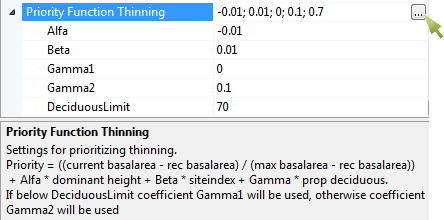
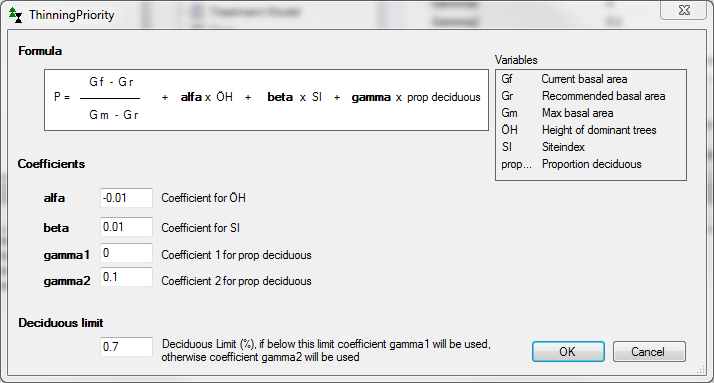
Figure 7. Priority function in RegWise for selection of stands to be thinned (control table Scenario Settings). If you click on the [...]-button (see green arrow in Figure 7) the dialog below is displayed (Figure 8).
Figur 8. Dialog for changing the thinning priority function in RegWise. |
Revenues from a thinning consists of revenues from timber, pulpwood and possibly bio fuel (if bio fuel extraction is done). Price lists and bucking settings are handled in the Pricelist Manager. |
Result variables for a thinning can be found in result groups Treatment and Financial Data. The treatment code for a thinning is "Th" or "Thinning" in result variable Treatment >Treatment. Thinning grade, relative diameter, thinning area etc. are also calculated, see Result variables, Harvesting.
|
